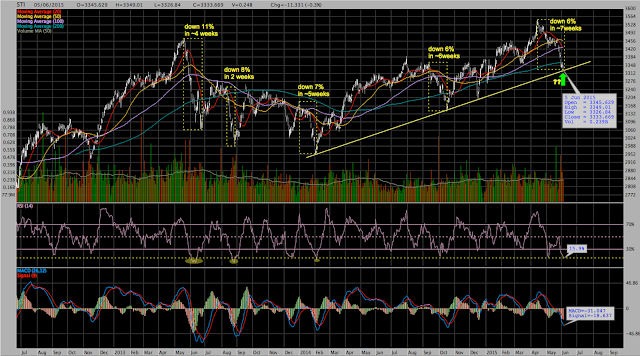
The RSI is now at the low level of the oversold region which could attract buyers for bargain hunting again (though it had also hit the same level a month ago). There is a high chance that the STI will consolidate at the current level and then back to the positive trend after this.
 |
| The Straits Times Index (STI) Technical Chart 2015-06-05 |
(click on the image to view larger chart)
p/s: If we look at a longer period since the previous peak of the STI in June 2013 till current date, the current adjustment (till last Friday) is considered 'mild' compared to the few other adjustments since then. Back in June 2013, the STI dropped 11% in a month immediately after it hit the previous peak of 3464.
Please feel free to leave your comments and share your point of view.


